Capillary condensation and hysteresis in gas phase adsorption
The first steps of the development of an adsorption process often involves a detailed investigation of the thermodynamics of gas-solid equilibria. In particular, isotherm are measured in a gravimetric or a volumetric setup. An isotherm in this context denotes the equilibrium between a fluid (adsorbate) on a solid (sorbent). It is frequently shown in the pressure-adsorption loading plane at a fixed temperature. Isotherms provide a first indication on the potential use of a sorbent in an adsorption process.
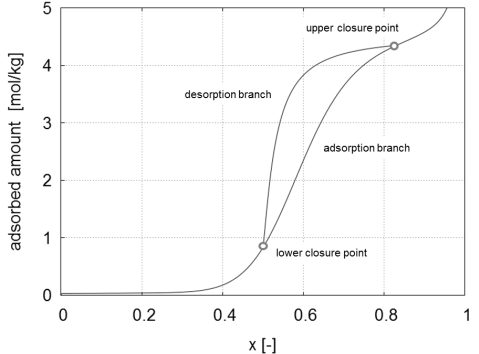
To enhance the surface area of the sorbent, these materials are usually porous. Pore sizes are, according to their sizes, divided into three classes: micropores (less than 2nm), mesopores (2-50nm) and macropores (greater than 50nm). In materials containing a portion of mesopores, a hysteresis loop is frequently observed , i.e. where the adsorbent loading and regeneration follow different paths in the adsorbed phase concentration versus partial pressure space. An example of such a hysteresis loop is illustrated in Figure 1.
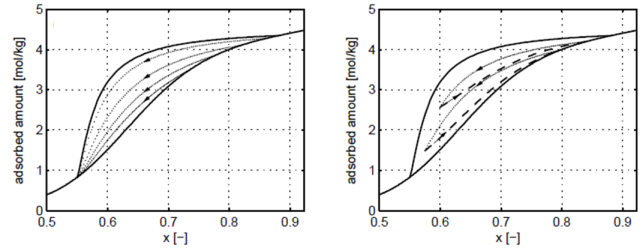
As indicated, there are the primary adsorption and desorption branches as well as the lower and upper closure points that characterize the hysteresis loop. While there are attempts to explain the hysteresis phenomenon on many levels, e.g. percolation theory, molecular dynamics, density functional theory or dynamic mean field theory [1], in our group, we focus on the effects and consequences of hysteresis on a process level. When facing the need to model adsorption separation processes in the presence of an adsorbate exhibiting hysteresis, one must describe not only its primary adsorption and desorption isotherms, but also the secondary ones, the so called scanning curves, i.e. the adsorbed phase concentration evolution undergone during regeneration or loading of a partially saturated or partially regenerated adsrobent, respectively. Moreover, one must incorporate not only the current composition and temperature of the gas phase, but also its adsorption/desorption history; in other words the model must keep memory of the past to able to describe the present state and the future evolution. A set of possible scanning curves are shown in Figure 2:
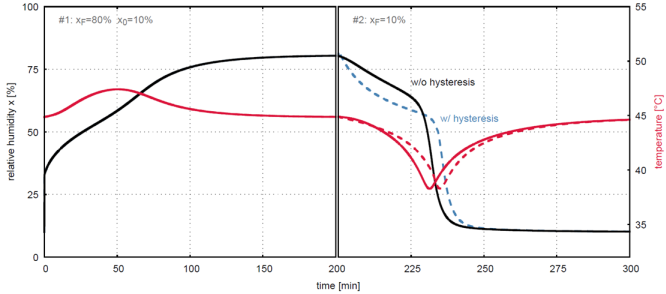
The effect of the hysteresis phenomenon on simulated breakthrough curves, that is the concentration profiles at the end of an adsorption column, is shown in Figure 3. The curves are indistinguishable during adsorption since the initial conditions are such that adsorption starts outside of the hysteresis loop, but differ during desorption due to hysteresis. As a comparison profiles ignoring the hysteresis phenomenon are also shown [2,3].
More complex dynamics, e.g. the presence of an additional component, are also being studied.


